The data shows success on social media
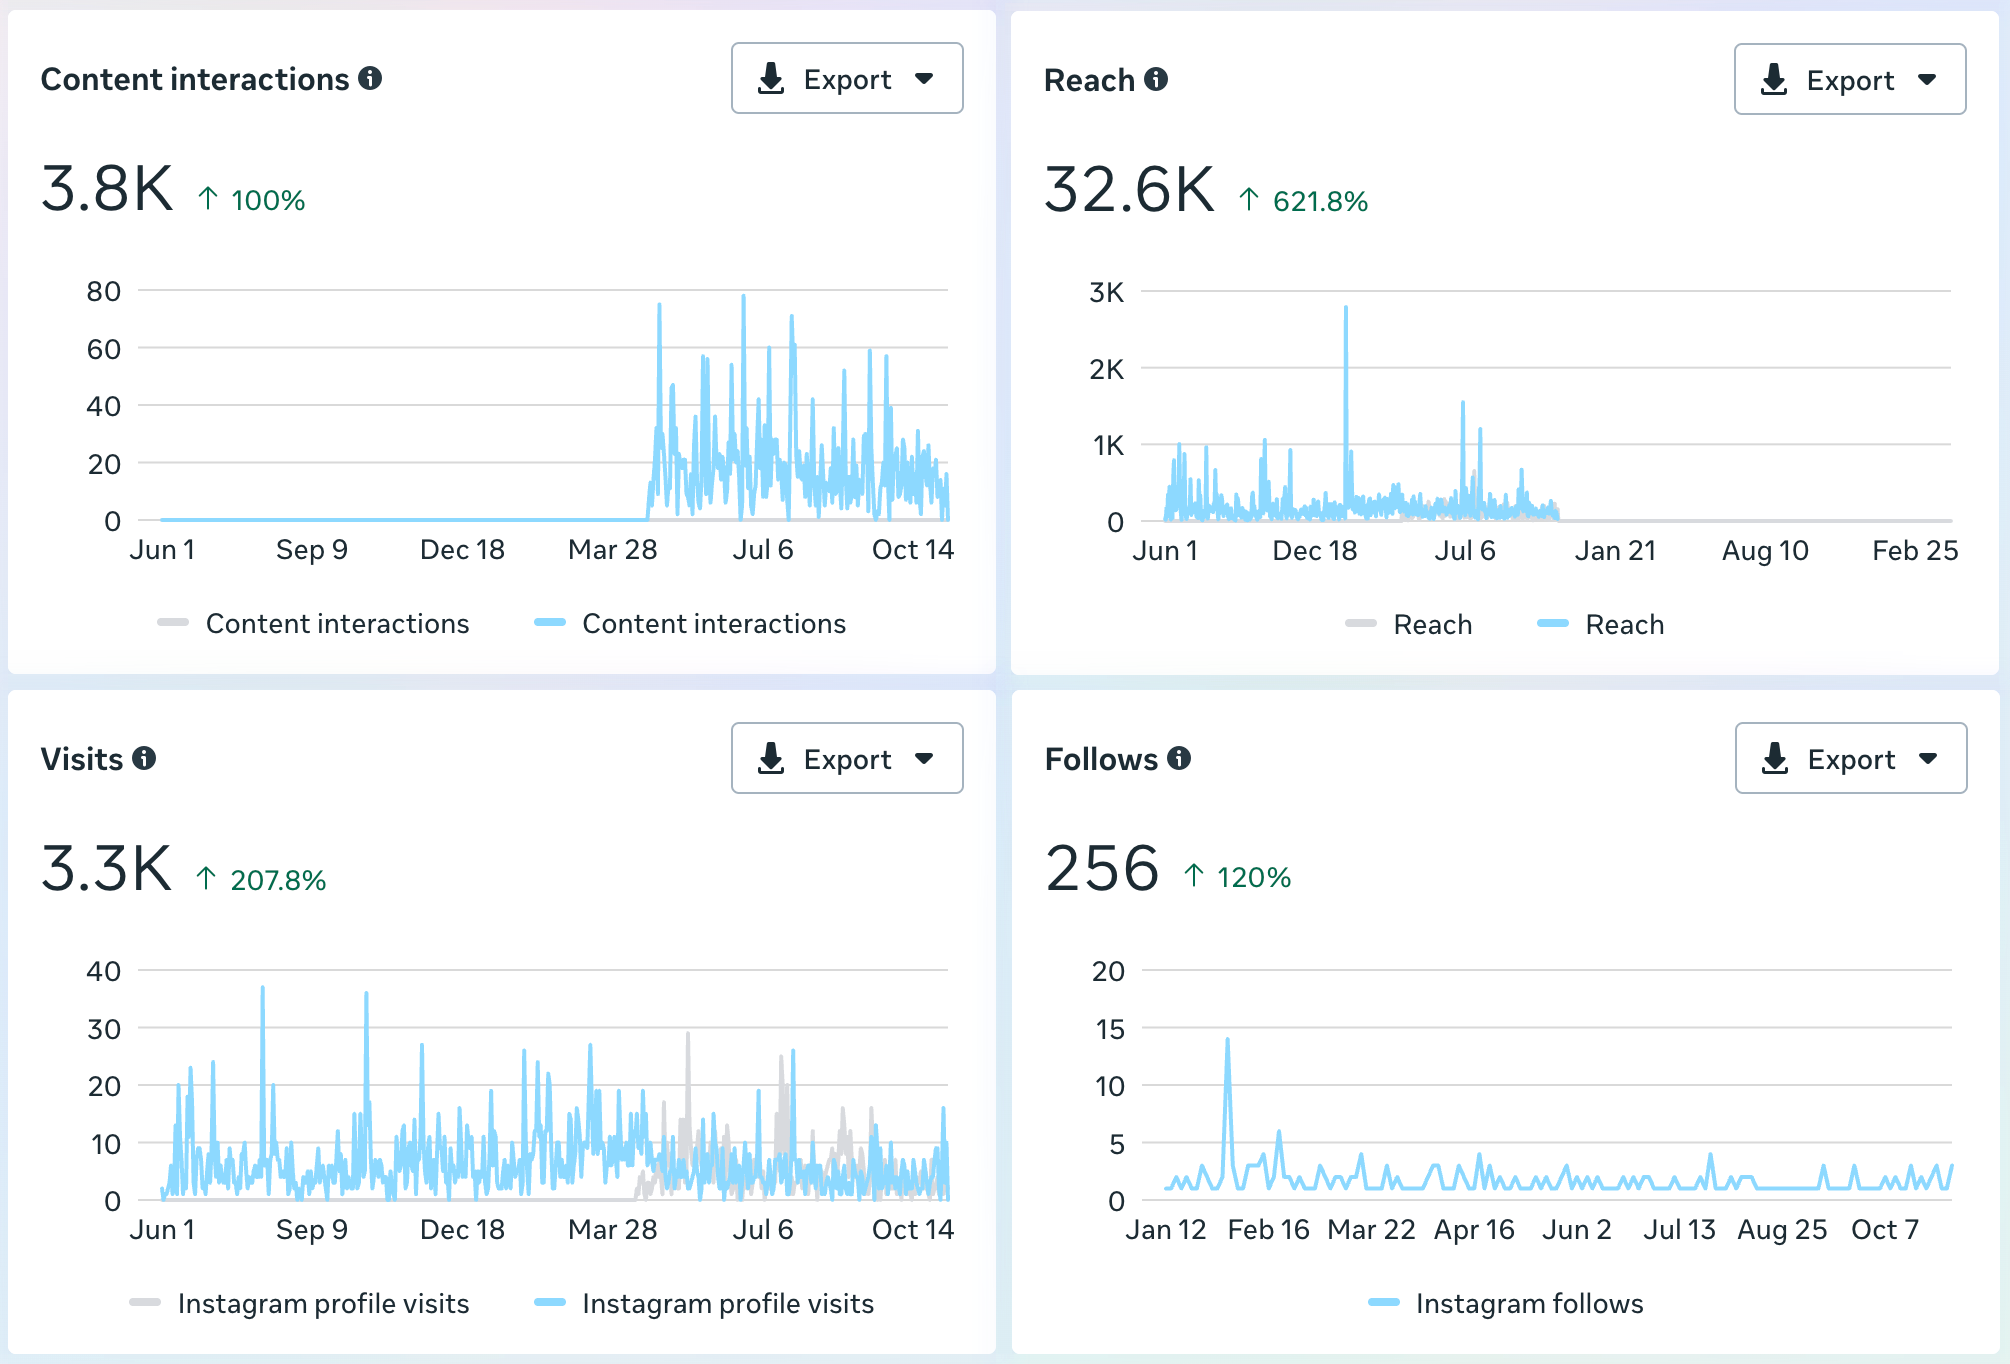
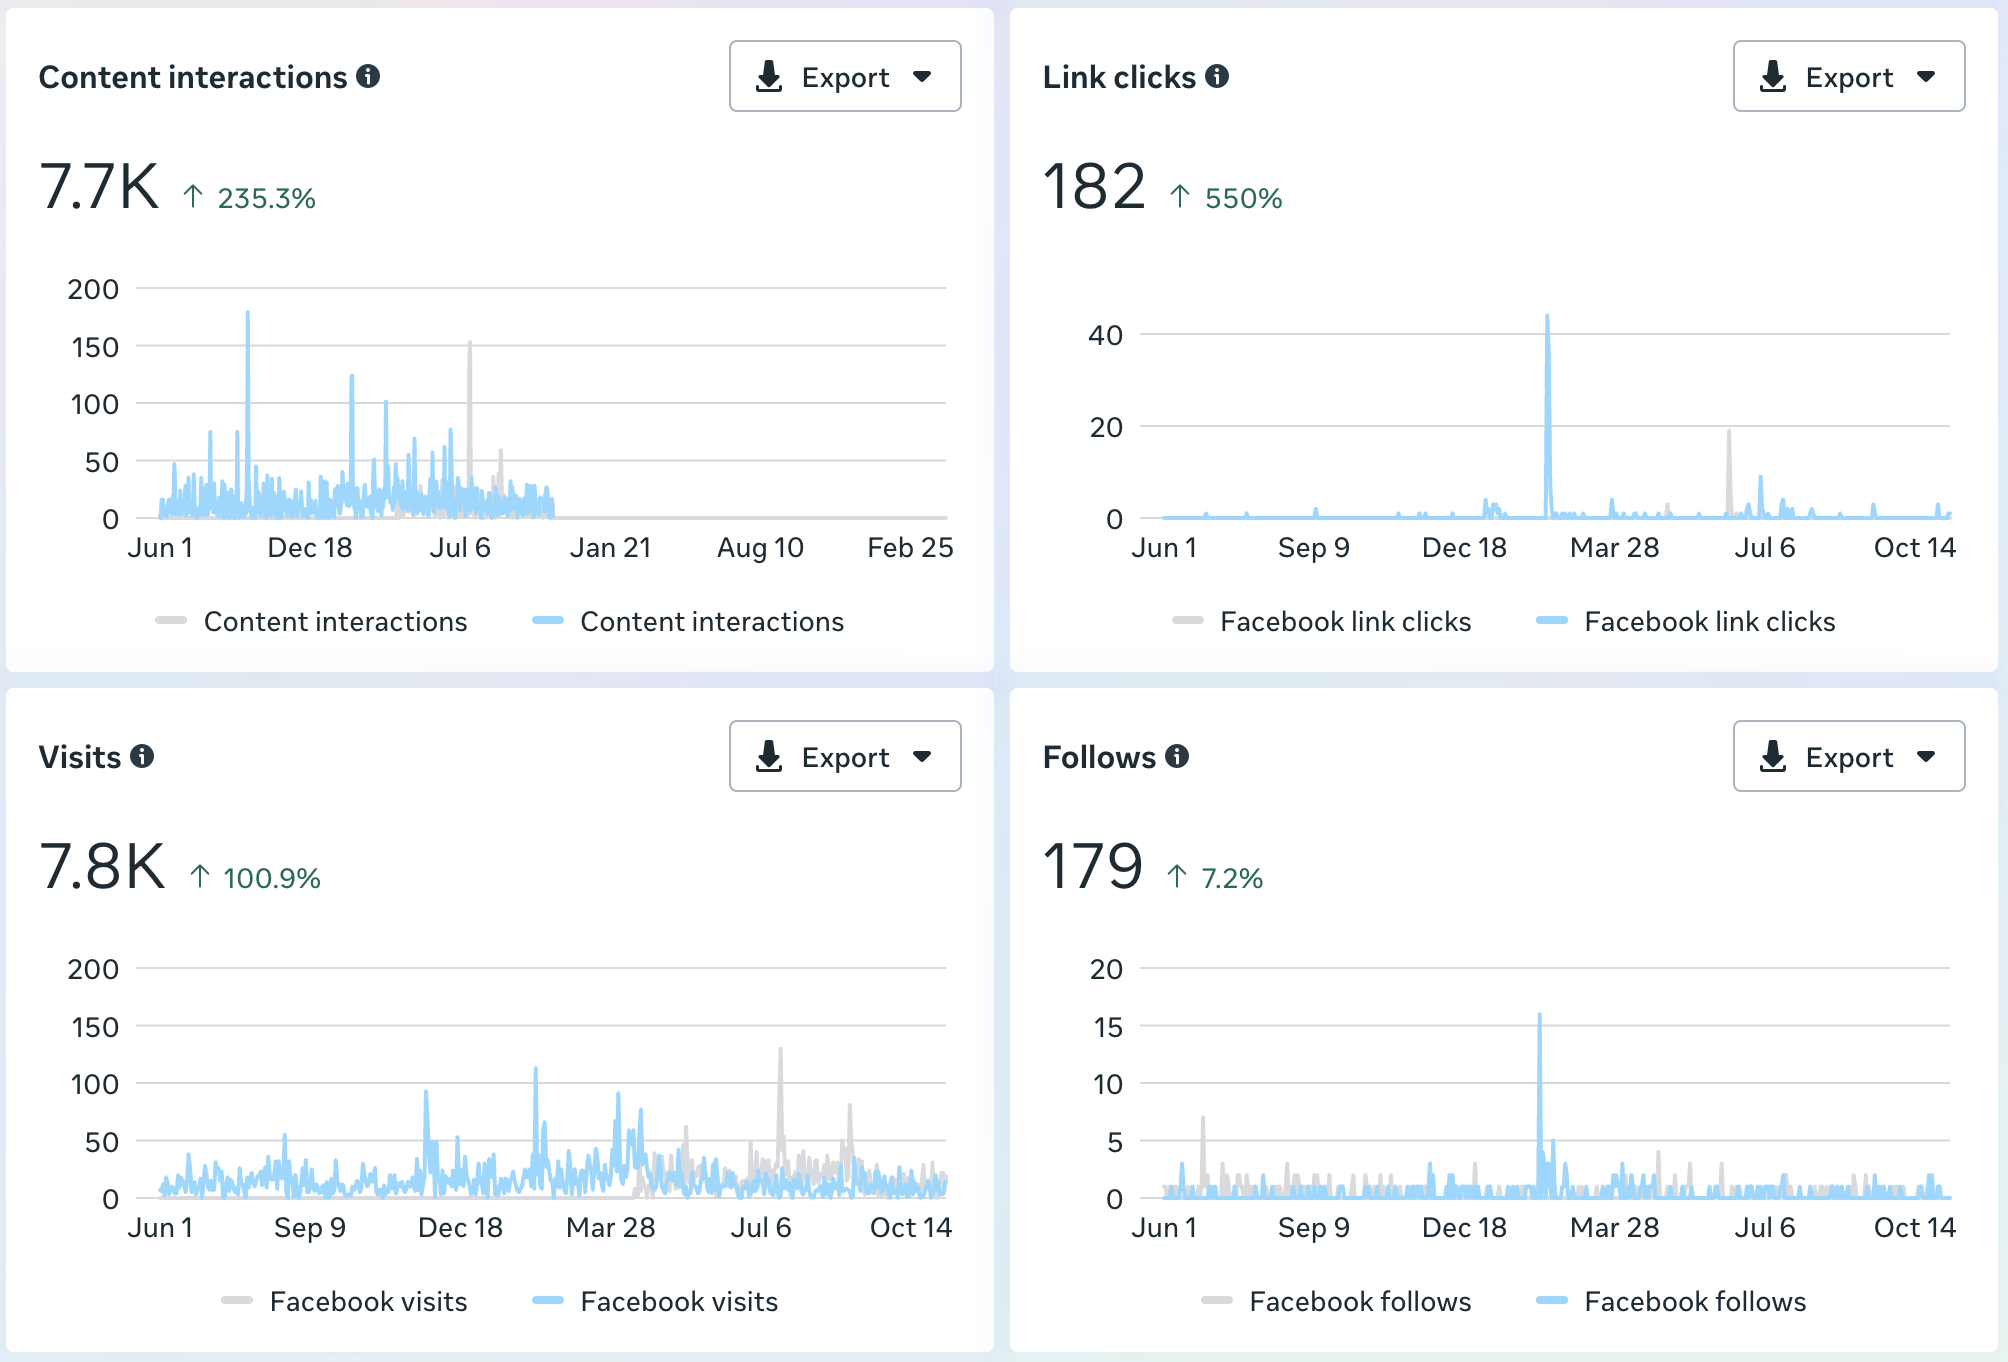
Since becoming the Social Media Manager & Digital Marketing specialist at Lore’s Chocolates I have seen a significant increase in all of the analytics on Facebook and Instagram.
I utilized end-to-end content creation from ideas to execution, each time tracking analytics to enhance future performances.
A Stand Out Reel
Why it works:
The thumbnail is click-worthy! The text includes strong words that elicit strong feelings at a quick glance. This makes people curious enough to click.
Then the actual content is educational, personable, and fun, keeping people engaged.
This content also includes location-specific information, which could encourage the audience to share with other local friends.
How it’s made:
This project started with an idea to interact with the community. I then recorded footage with a colleague and wrote a script for a voice-over based on the content. Video editing was done in DaVinci Resolve and CapCut.
A Stand Out Post
Why it works:
An important aspect of small businesses is the family that owns them!
Social Media has the word “Social” because it is important to build relationships with the community. The audiences on Facebook want to feel like the small companies they support are run by real people.